Overview
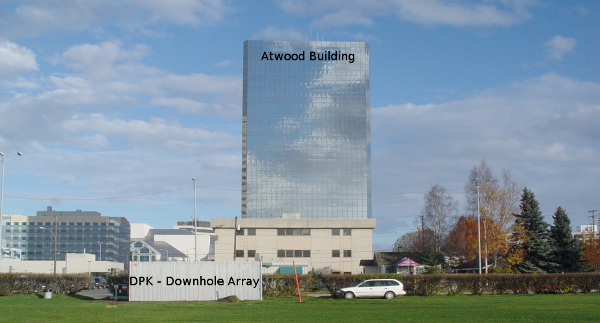
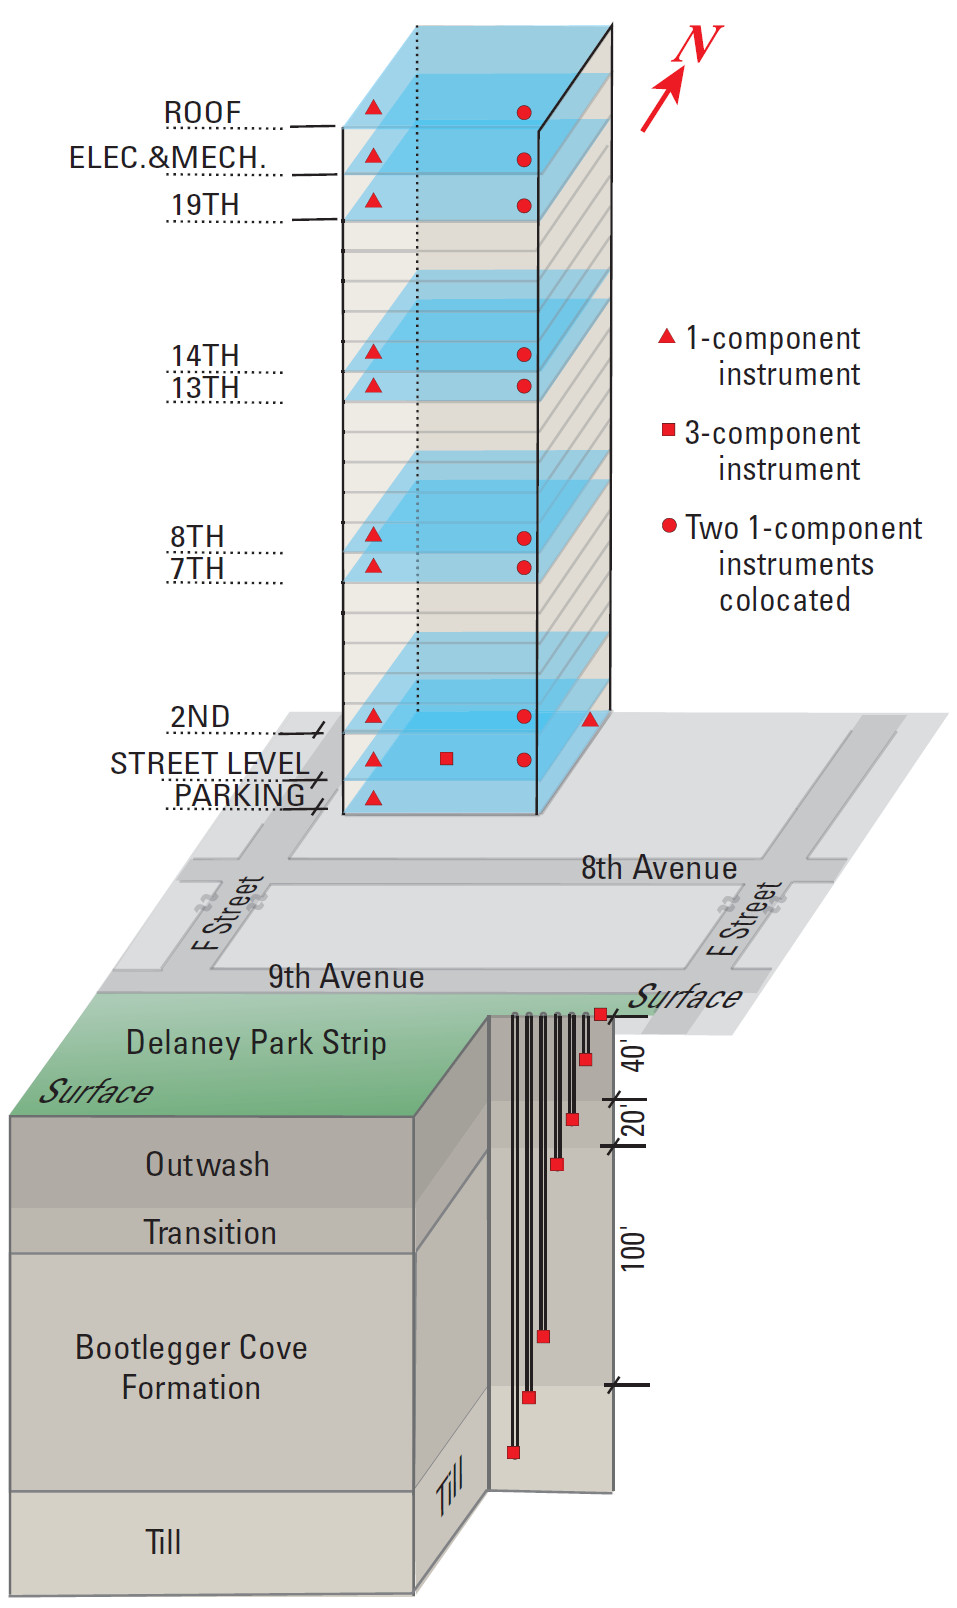
The Atwood building is instrumented from the basement to the roof with a total of 32 accelerometer sensors. The building is located just two blocks north of the Delaney Park downhole array. Together the form a richly instrumented system that records local ground motions and building response.
The complete instrumentation details are illustrated by this diagram (courtesy of the USGS).
For more information see the USGS fact sheet:
Çelebi, M., McCarthy, J., Biswas, N., Wald, L., Page, R., and Steidl, J., 2004, Seismic Monitoring of the Atwood building in Anchorage, Alaska: U.S. Geological Survey Fact Sheet 2004-3103
http://pubs.usgs.gov/fs/2004/3103/
Build motion visualizations for real events
This video https://www.youtube.com/watch?v=Nt0m5JWa62w presents a visualization of how the Atwood Building in Anchorage, Alaska, shook during the M7.1 January 24, 2016, Iniskin, Alaska, earthquake. The building was instrumented by U.S. Geological Survey to obtain data to study its behavior and performance during strong shaking. Such data is useful to make decisions for improving the building's performance. The video of the building exhibits, translational, torsional motions, as well as beating effects.
Note that the visualization is magnified by a factor of 300 to show its deformation characteristics. Produced by: Mehmet Celebi (USGS), Mark Bonito (USGS)
This video https://www.youtube.com/watch?v=9MlvLdnwLY4 presents a visualization of how the Atwood Building in Anchorage, Alaska, shook during the Mw 7.0 November 30, 2018, Anchorage, Alaska, earthquake. The building was instrumented by the U.S. Geological Survey to obtain data to study its behavior and performance during strong shaking. Such data are useful in making decisions about improving the performance of the building. Translational (back-and-forth) motion (more dominant in the East-designated direction) and limited torsional (twisting) motions are both observed, as well as limited beating effects (alternating cycles of generally increasing and decreasing levels of motion that occur when the structural damping of a building is low and when frequencies of translational and torsional motions are close).
Note that relative to the height of the building, the motions are magnified by a factor of 100 to show how the building deforms.